
(See 2015 Final Report)
As for how it was in 2012 ...

Much of the criticism directed at HAS has been focused on its euthanized #s. Despite a huge decline in those #s in recent years an outdated myth persists.
Historically, HAS has been "a high kill" shelter with seriously overcrowded conditions and a dismally high euthanized rate of approximately 50%. As recently as 2012, when 1, 781 of the 3,908 cats (47%) we're euthanized, this picture of HAS remained valid. But things have changed since then and the current reality is vastly different. In 2013 the # was down to 971 of 3,375 (29%) and in 2014 it dropped further to 641 of 2,835 (23%).
The bar graph below, showing both the Intake and the Euthanized #s from 2007 to 2014, allows one to get something of an historical perspective.
It illustrates a decline in Intake starting in 2009 and, as of 2011, a decline also in the # being euthanized. The 2012 # was significantly down (by 956) from what it was in 2007 and the further reductions in 2013 (by an additional 801) and in 2014 (by another 330) show that this downward trend is continuing.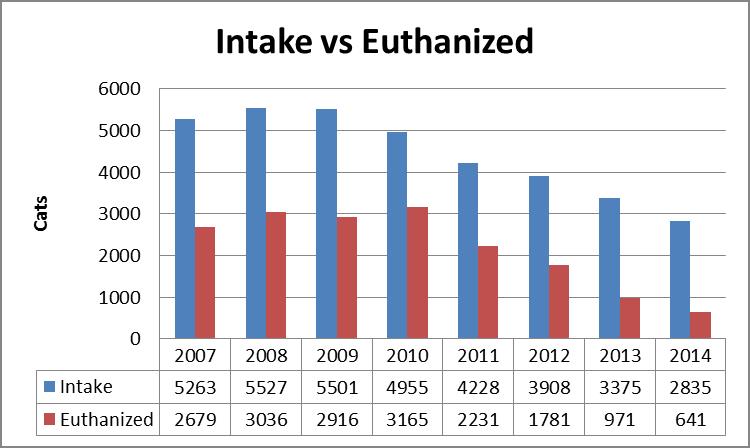
To get a feel for what this means and for how different things are at HAS from the way the used to be, one need only contrast the 2010 euthanized # (3,165) with the 2014# (641) and realize that the difference is 2,524 fewer cats being euthanized.
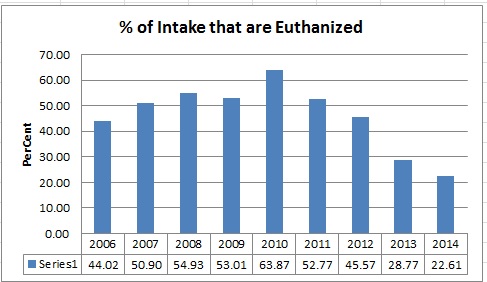
This change is very much connected to the Intake #s. The bar graph below, showing the % of Intake that are euthanized yearly, illustrates how the rate fluctuated prior to 2012 and then began to steadily decline.
Numbers can mislead and are too often used to bolster mere opinion but, when reliably collected, carefully examined and cautiously interpreted, they can help to clear away confusion and challenge outdated beliefs and they can provide an objective way to measure change.
The 2014 euthanized rate of 23% is good news; it signals a rate not far from many other cities including places like Calgary to which Hamilton had often been unfavourably compared. However, this good news tends not to be getting reported in the media and it seems that opinion rather than factual information continues to shape public perception.
A CBC news item, Hamilton Animal Services wants to kill fewer cats(July 17, 2014) gives an idea of how emotions around 'the killing of cats' are still running high and it shows how, despite the current reality, outdated (and inflammatory) labels like "extermination facility" continue to be used in reference to HAS
.
Karen Edwards, Animal Services Advisor at HAS, responding to the CBC news item, had this to say:
I have been hearing that people still feel that our euthanasia numbers are high. I think that the public is not aware of some of the factors involved and the hard decisions made with the euthanasia of animals here...read more
More attention needs to be paid to these details - to the cats and what actually happens to them. The numbers examined above can tell us only that, as Intake has declined in recent years, so too has the # being euthanized but in order to be able to respond in any way other than emotionally and begin to engage in any constructive thinking about how to further decrease that euthanized #s one needs to be realistic.
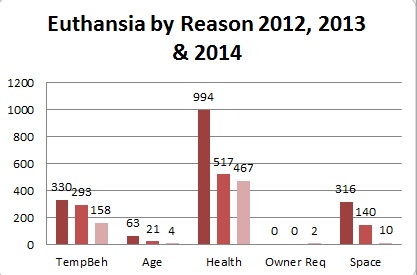
The year-end stats, giving the reasons to euthanize, are available for the past three years.
In any given year some cats are euthanized at owner request. This is always a small #. In 2014 the # was 2. In the remaining cases, the reasons to euthanize according to HAS data were:
Temperament/Behaviour - the # in 2014 (158) was down from the previous year by 142. These cats were presumably feral, aggressive, or "depressed" (hiding, refusing food.) In some cases, the decision may have been quite subjective and, in other cases, the observed temperament/behaviour may have been a reaction to the living conditions - being caged with little comfort or stimulation.
Age - the # in 2014 (4) was down from the previous year by 17. The older the cat, the more likely it is that there will be additional costs (for dental work or other medical issues) and the more difficult it will be to find the cat a home. Understandably most rescue groups are prone to take the young cats first, leaving the seniors behind. Some rescues do try to take as many seniors as they can; often it's seniors who are left waiting a long time to get rescued (see News Alert, October, 17, 2014)
Health - the # in 2014 (467) was down from the previous year by 50. Health is always the largest category and there are limits to how much further down the # can drop. Cats often arrive at HAS seriously injured, sick or with medical conditions that are either untreatable or extremely expensive to treat. It would be helpful to know how often this decision simply reflects a humane end-to-suffering. It's likely that the decline between 2013 and 2014 could be attributed to an increased effort made last year by the HBSPCA and several of the other local rescues to take sick/injured cats into their care.(see News Alert, Nov. 14, 2014 entitled 'Saving the seriously injured relies on private funding.')
Space - the # (10) in 2014 was down from the previous year by 130. Likely it reflects, as well as the reduced overcrowding attributable to changes in pick-up, the effects of the many times during the summer when HAS close their doors to new admissions until enough cages could be cleared to avoid euthanizing for space. (see News Alert, Sept. 5, 2014 entitled 'Closed doors at HAS: What does it mean?')

To keep up-to-date on euthanaization numbers, see the ticker-tape (at the bottom of tthe Home page). As of January 2015 these updates are posted monthly.
