
(See 2015 Final Report)
As for how it was in 2012 ...
How does HAS compare with animal services in other cities?
In early 2013 HAS requested information from several nearby Ontario cities and from Calgary, which has the reputation of being "the gold standard."
Only three of the Ontario cities, Toronto, Oakville, and Burlington, provided sufficient data to allow for any comparison. And what became immediately apparent was that the types of stats collected and the way animal services, local humane society/spca, and rescue groups in each area operated differed so much from city to city that only limited information could be gleaned and it was difficult to draw any conclusions.
The data did, however, suggest a couple of things.
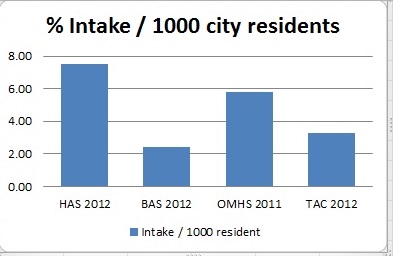
The first was that, as of the end of 2012, the intake rate (the total number of cats taken in per 1,000 residents) was significantly higher in Hamilton than in the other municipalities.
| HAS 2012 | Burlington AS 2012 | Oakville HS 2011 | Toronto AC 2012 | |
| Total In | 3908 | 425 | 1060 | 8539 |
| Intake / 1000 resident | 7.52 | 2.42 | 5.81 | 3.27 |
 There is a direct and obvious connection between the number of cats taken in and the number euthanized; the fewer cats brought in, the fewer there are that end up euthanized. So, this relatively high intake rate at HAS can be seen as a major (and possibly key) factor in HAS's long standing reputation as a particularly "high kill" shelter.
A 2007 consultant's report, commissioned by the City, pointed to the expensive "euthanasia production process" and, following the logic that the more taken in, the more have to be euthanized at a cost, suggested that the mandated pickup of alleged stray cats be discontinued.
No action was taken on this suggestion until 2011 when the hours during which HAS was required to respond to non-emergency pick-up requests were cut from 24/7 to business hours only. At this point intake numbers did begin to decline and there were signs of a corresponding reduction in the number of cats euthanized.
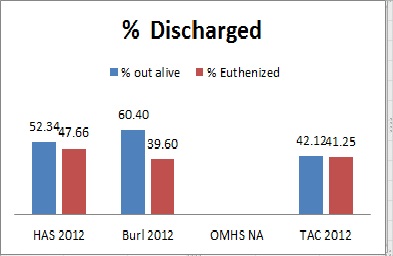
The second observation from the 2012 comparison was that Hamilton's euthanasia rate was higher (though not as dramatically higher as many people would expect).
 It's often pointed out that "high volume" is connected to "high kill" and the reasons given are:
(1) limits to capacity can mean that overcrowding can dictate that some must be killed for "space."
(2) overcrowded conditions can contribute to the shelter stress and to the spread of infectious diseases both of which can result in cats being euthanized for health reasons or because of temperament/behaviour.
It is argued that, by taking measures to reduce Intake, the funds saved from reduced euthanasia (and cremation) can be re-allocated to veterinary services that address the treatment of injuries and illness identified at intake, and for spay/neuter programs.
At the point when HAS was taking the first step toward reducing Intake, these other cities had already been moving in the direction of reducing (or eliminating entirely) their pick up services.
Toronto, for example had already, at the beginning of 2012, put a stop to pick-up and was instead informing people who called about strays that "there is no by-law prohibiting cats from being at large and that it will likely return to its residence in a few days. If the cat is still hanging around their property or causing a nuisance, the finder can bring the cat into one of their animal centres. And owner surrenders are only done through appointment." Toronto attributed a significant decline in both Intake and euthanasia in that calendar year to this change in policy.
Not everyone agrees that taking such steps to reduce Intake is a good thing. It can reasonably be argued that not all owned cats find their way back home, that many of the cats people request be picked up are "unfixed" strays that will contribute to the overpopulation problem, and that people wanting to help these cats are left without a "last resort" option.
However, virtually every city trying to reduce the numbers euthanized in their city shelters each year has been reducing intake. This is the direction in which HAS has been heading since 2012 and, by 2014, the HAS policy had become similar to that of TAS. The 2014 updates on Intake and Euthanized at the bottom of the Info Section pages show how things are changing here and the ticker-tape at the bottom of the Home page provide YTD figures.
